USD/RUB Price Analysis: Further downside needs validation from 62.80
- USD/RUB holds lower ground near two-year low, pressured of late.
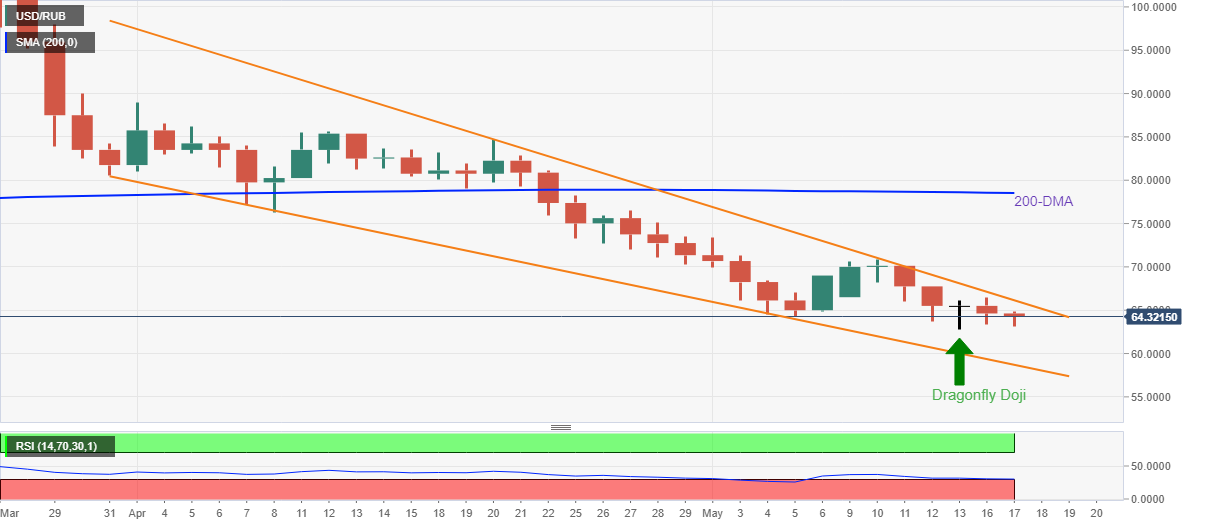
- Falling wedge bullish chart pattern, Dragonfly Doji tests USD/RUB sellers.
- Bulls need clear break of 200-DMA to retake control.
USD/RUB remains on the back foot for the second consecutive day, after bouncing off a two-year low. That said, the Russian ruble (RUB) pair seesaws around 64.31 by the press time of the pre-European session opening on Tuesday.
Although the quote refrains from renewing the multi-month low of late, a sustained trading below the 200-DMA and a monthly falling trend line, forming part of the falling wedge bullish chart pattern, challenges the recovery moves.
Even so, oversold RSI conditions hint at an intermediate recovery of the USD/RUB prices, which highlights the aforementioned resistance line of the wedge, around 66.15, as a nearby key hurdle ahead of the 200-DMA level surrounding 78.50.
In a case where USD/RUB rises past 78.50, the 80.00 threshold and April’s high of 84.75 will be in focus for short-term upside moves. However, any further advances beyond 84.75 could help the bulls to approach the theoretical target of the wedge, around 92.00.
Meanwhile, a downside break of the latest low near 62.80 rejects the bullish signals flashed by the Dragonfly Doji candlestick.
Following that, a downward trajectory towards the wedge’s support line, at 58.70 by the press time, can’t be ruled out.
USD/RUB: Daily chart

Trend: Limited downside expected
