WTI Price Analysis: On the bids near yearly top above $54.00, OPEC in focus
- WTI stays positive while flirting with February 2020 top.
- Overbought RSI conditions probe bullish chart formation around nearby resistance.
- 21-day SMA, channel support close adjacent doors for seller’s entry.
- Headlines from OPEC meeting will be the key to follow.
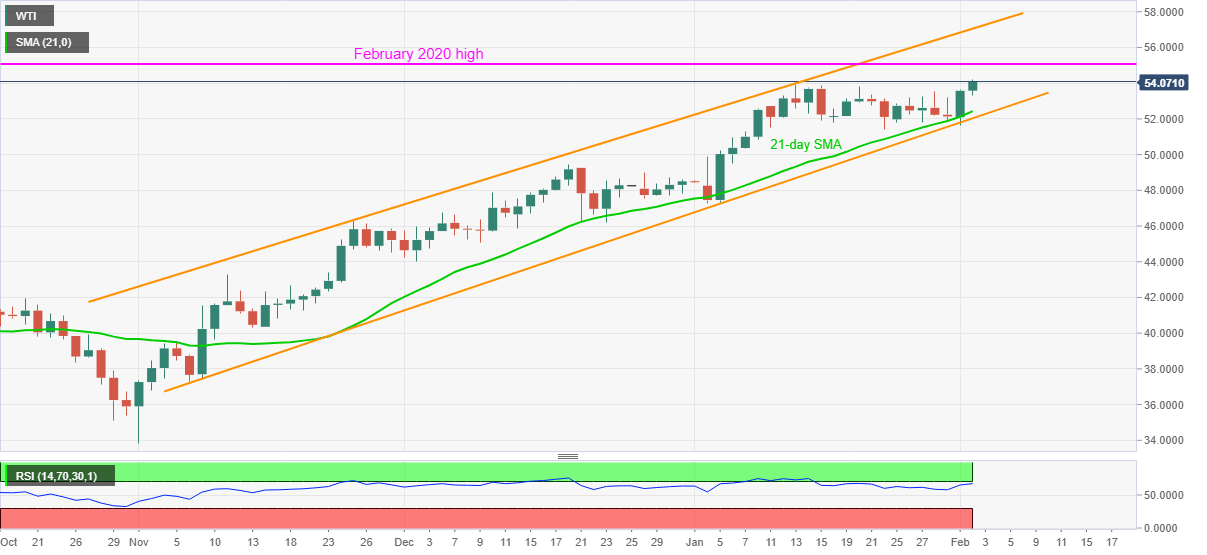
Having recently bounced off $53.96, WTI teases the intraday high around $54.25, also the highest since February 2020, while heading into Tuesday’s European session. In doing so, the oil benchmark justifies the previous day’s recovery moves from 21-day SMA and an ascending trend channel’s support ranging from November 2020.
Although bulls are in full mood, overbought RSI conditions may trigger pullback around February 2020 peak surrounding $54.70.
In a case where the oil buyers keep dominating past-$54.70, the $55.00 round-figure may offer an intermediate halt to the rally targeting the mid-January 2020 lows near $57.40.
On the flip side, a daily closing below the 21-day SMA level of $52.43 needs validation from the stated channel support, currently around $52.00, to convince the WTI sellers.
If at all the anticipated pullback extends below $52.00, December 2020 tops near $49.40 should return to the charts. Though, the $50.00 threshold can offer an intermediate halt during the fall.
Overall, oil prices remain strong and eye early 2020 levels. However, today’s OPEC meeting may trigger the much-awaited pullback in case of negative surprises.
WTI daily chart

Trend: Bullish
