Gold Price Analysis: XAU/USD eyes PMIs for fresh push to cross $1,953/54 hurdle – Confluence Detector
Gold prices struggle to keep the intraday gains while bouncing off $1,940.79 to currently around $1,950, up 0.10% on a day, during the pre-European session on Friday. In doing so, the yellow metal retraces from the one week low flashed Wednesday while rising for the second day in a row.
Although the US dollar’s latest weakness becomes the eye-candy for the gold buyers, recovery in risk-tone sentiment, amid upbeat stocks and hopes of US-China trade deal, exert downside pressure on the bullion. Additionally, hopes of the American stimulus, as recently kindled by the Democrats, also favor the bears.
Alternatively, mixed sentiment concerning the coronavirus (COVID-19) wave 2.0 and the greenback’s trading near the 27-month low keep the buyers hopeful.
Key levels to watch
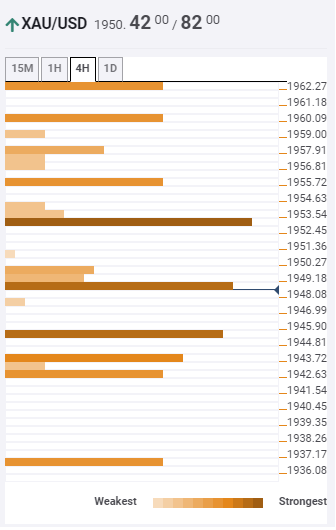
Out own Technical Confluences Indicator portrays the mixed momentum of the yellow metal while focusing on the previous high on the four-hour (4H) chart around $1,953/54 as near-term key resistance.
It should, however, be noted that the earlier top on the daily formation (D1) close to $1,956 adds to the nearby upside barriers.
In a case where the buyers manage to cross $1,956, the first pivot on the D1 around $1,961 and 5-day SMA close to $1,963 will be important to watch.
Meanwhile, 5-bar SMA on 4H and previous lows on the four-hour and hourly charts together form $1,945 as the strong downside support.
Overall, the metal remains bullish unless breaking a $1,931 level comprising 23.6% Fibonacci retracement of the last one month.
Here is how it looks on the tool
About the Confluence Detector
The TCI (Technical Confluences Indicator) is a tool to locate and point out those price levels where there is a congestion of indicators, moving averages, Fibonacci levels, Pivot Points, etc. Knowing where these congestion points are located is very useful for the trader, and can be used as a basis for different strategies.
Learn more about Technical Confluenc