Back
25 Mar 2020
Gold Price Analysis: 61.8% Fibonacci questions pullback targeting $1,600
- Gold prices step back from two-week high.
- Key Fibonacci retracement support, bullish MACD can question the sellers.
- Buyers may follow the weekly resistance line for short-term direction.
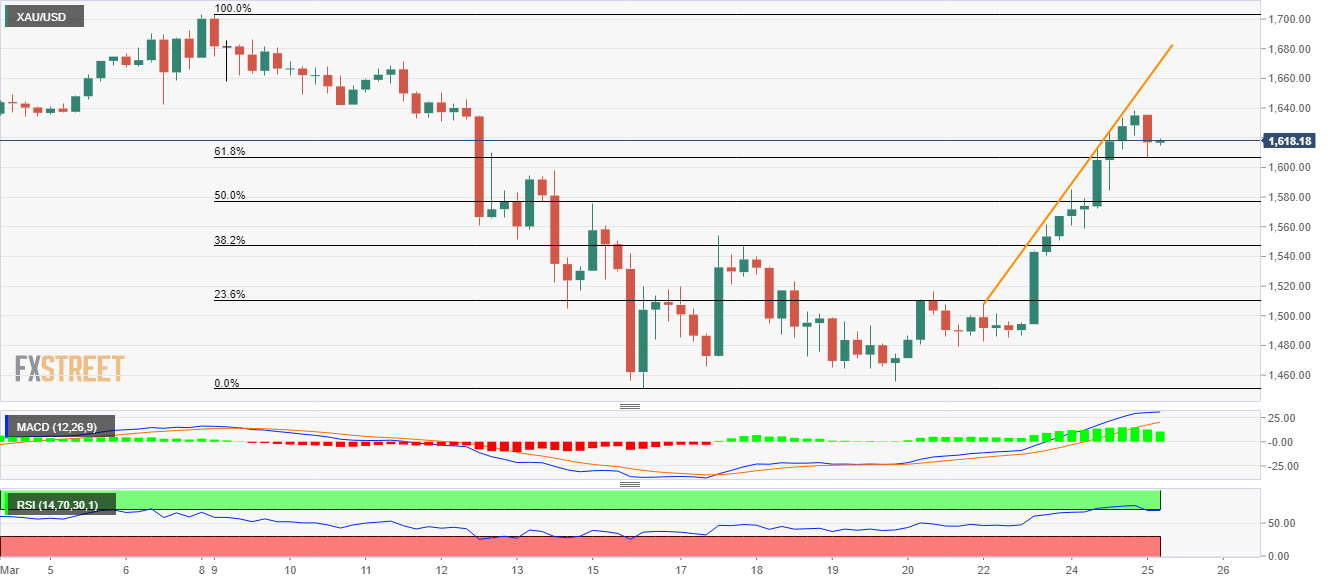
Following its failure to cross $1,640, Gold prices slip to $1,617, down 0.75%, ahead of the European session on Wednesday.
While overbought RSI could be considered as a reason for the latest pullback, 61.8% Fibonacci retracement of March 09-16 fall, near $1,607, seems to hold the key for the metal’s drop towards 1,600 mark.
In a case where the bullion stays below $1,600, 50% Fibonacci retracement could be of interest to the sellers.
On the upside, buyers will enter once the quote rises again beyond $1,640 to aim for the short-term rising trend-line, currently at $1,671.
Given the metal’s sustained run-up past-$1,671, the monthly top beyond $1,700 will be on the bulls’ radars.
Gold four-hour chart
Trend: Bullish