Back
28 Oct 2019
US Dollar Index technical analysis: DXY consolidates last week’s gains, trades above 97.70 level
- The US Dollar Index (DXY) is trading off five-day highs as the buck is trading mixed this Monday.
- The main resistances are seen near 97.90 and 98.20 price levels.
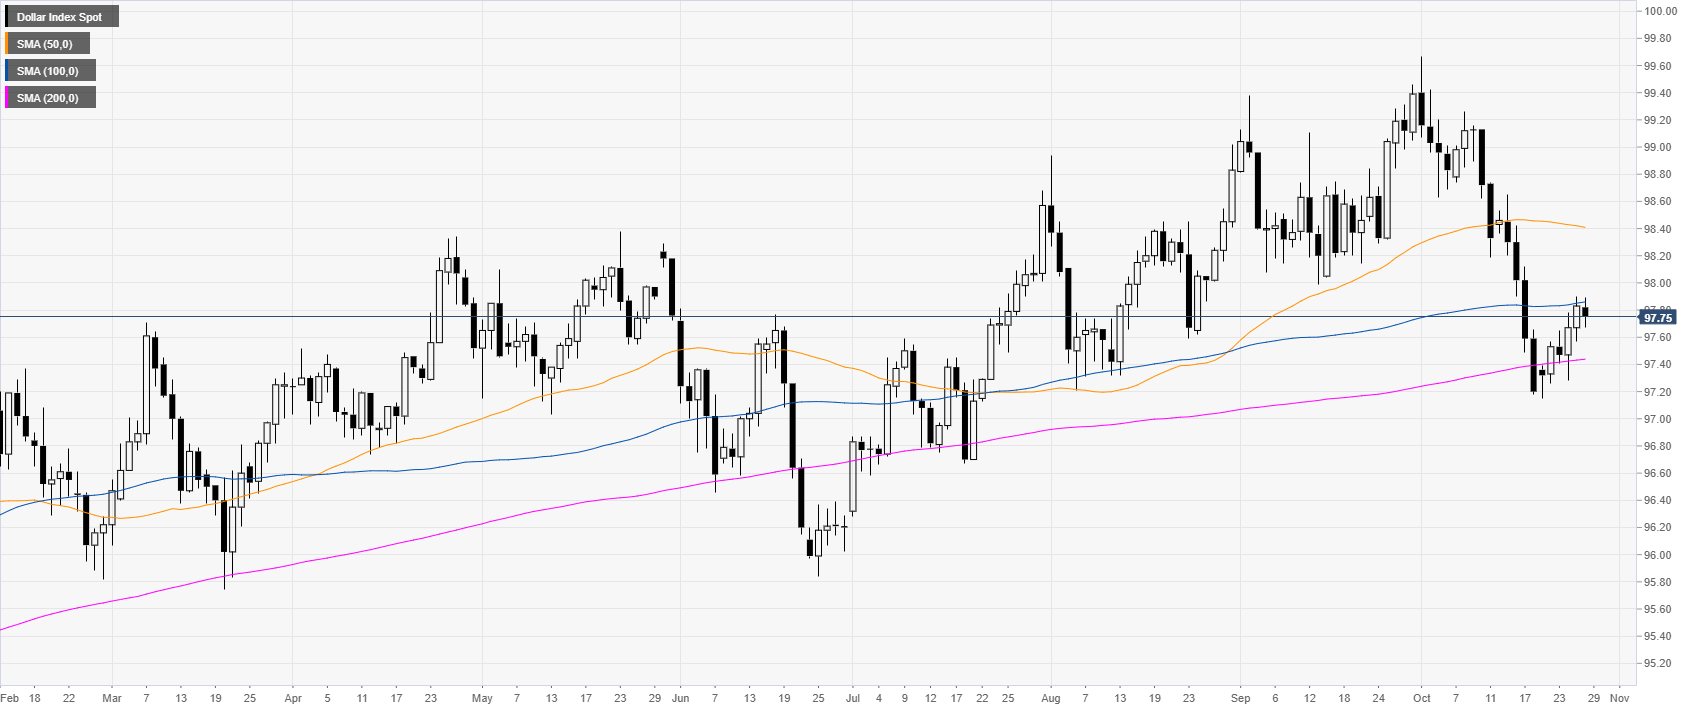
DXY daily chart
The US Dollar Index (DXY) is trading above the 200-day simple moving average (DMA) after a sharp decline in October. This Monday, the buck is trading mixed, consolidating the gains made last week. The market will need to surpass the 100 DMA near 97.86 to boost the potential recovery.
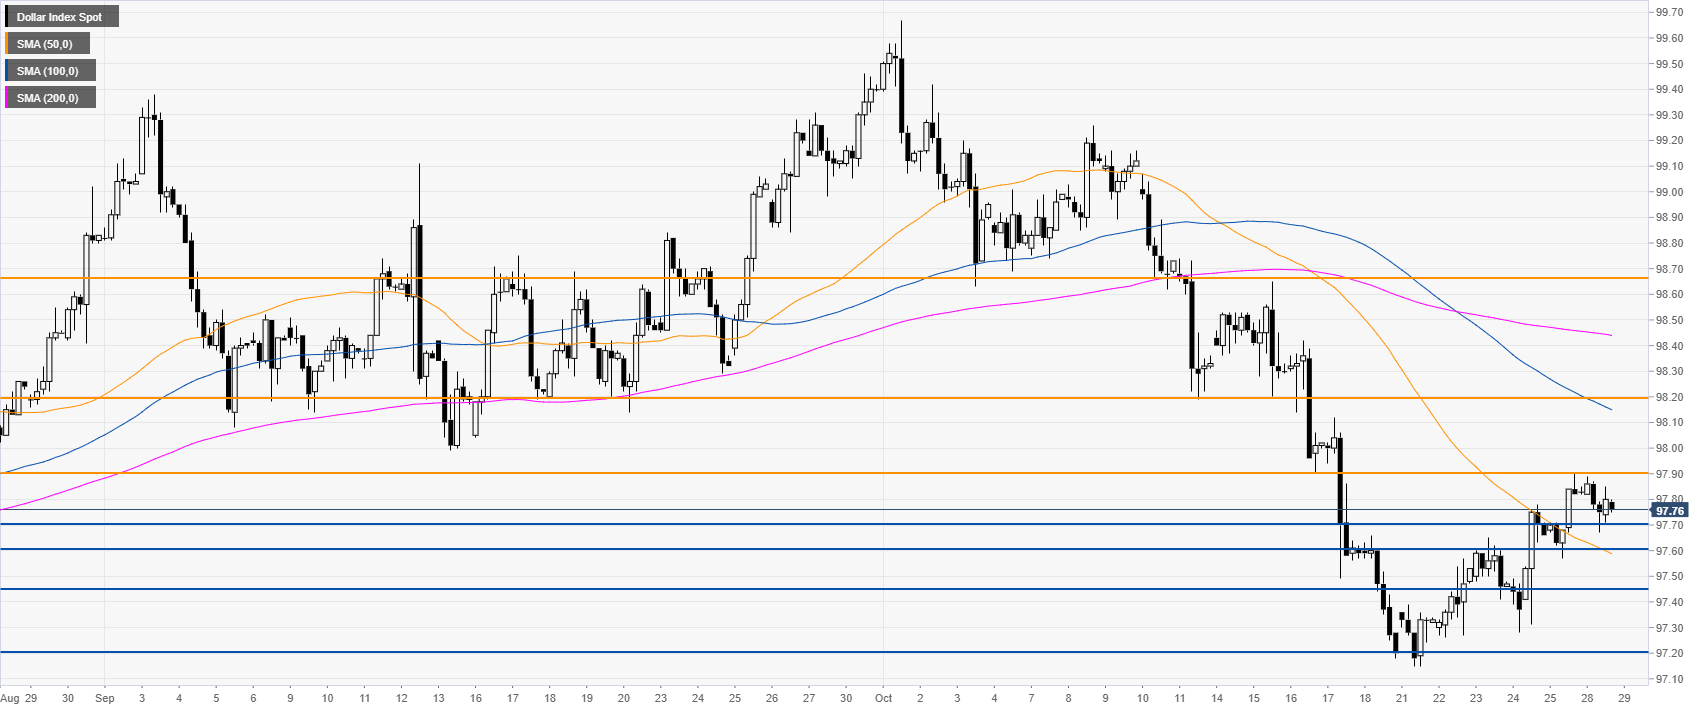
DXY four-hour chart
On the four-hour chart, DXY is trading above a descending 50 SMA. In order to gain credibility, the recovery would need to break 97.90 to potentially reach 98.20 and 98.66 price levels on the way up.
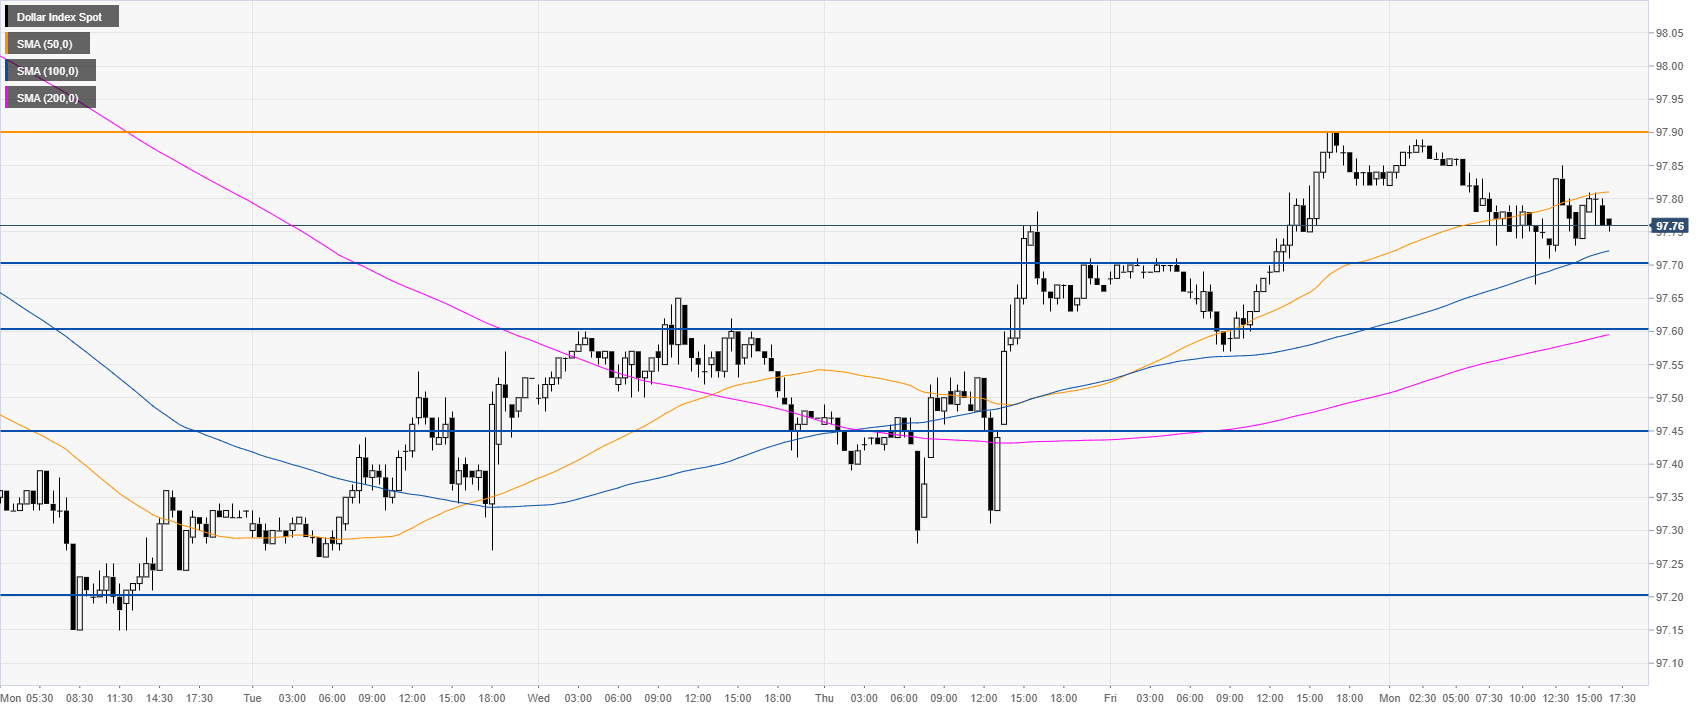
DXY 30-minute chart
DXY is trading above its 100 and 200 SMAs, suggesting a bullish bias in the short term. Support is seen in the 97.70/60 zone and further down at the 97.45 level.
Additional key levels