GBP/USD technical analysis: Losing altitude after bearish Doji reversal
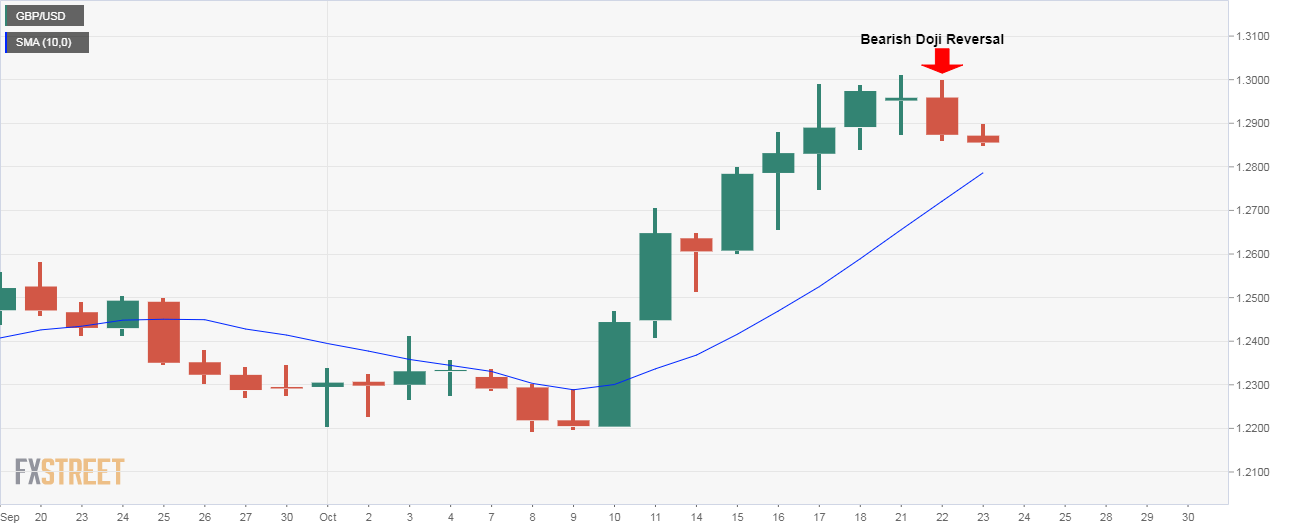
- GBP/USD's daily chart shows a bearish reversal pattern.
- Lingering Brexit uncertainty could keep the GBP under pressure.
- The ascending 10-day average support could soon come into play.
GBP/USD is facing selling pressure in the Asian session with the daily chart reporting a bearish candlestick pattern.
The currency pair is currently trading at 1.2854, representing 0.13% losses on the day, having closed Tuesday below Monday's low of 1.2874.
Tuesday's weak close and a drop to 1.2854 in the Asian session indicates the period of indecision represented by Monday's Doji candle has ended with ended in a victory for the bears.
So, now the path of least resistance is to the downside. Supporting the bearish case is the pair's dip below the 100-hour moving average, the first since Oct. 10.
Also, the crucial 50-hour MA support has been breached. That average had consistently reversed pullbacks during the rally from 1.22 to 1.30.
All-in-all, a deeper drop to the 10-day MA, currently ta 1.2784, could be in the offing.
The bullish view would be revived if the spot finds acceptance above Monday's high of 1.3012, although as of now, that looks unlikely.
The Pound will likely remain under pressure as Brexit bill's defeat in the UK parliament has made it unlikely that Britain would leave the European Union before the Oct. 31 deadline.
Daily chart

Trend: Bearish
Technical levels
