Back
24 Sep 2019
USD/JPY technical analysis: Greenback is at daily lows against Yen, near 107.30 level
- USD/JPY is weakening as the market is dropping from the September highs.
- The level to beat for sellers is the 107.22 support level.
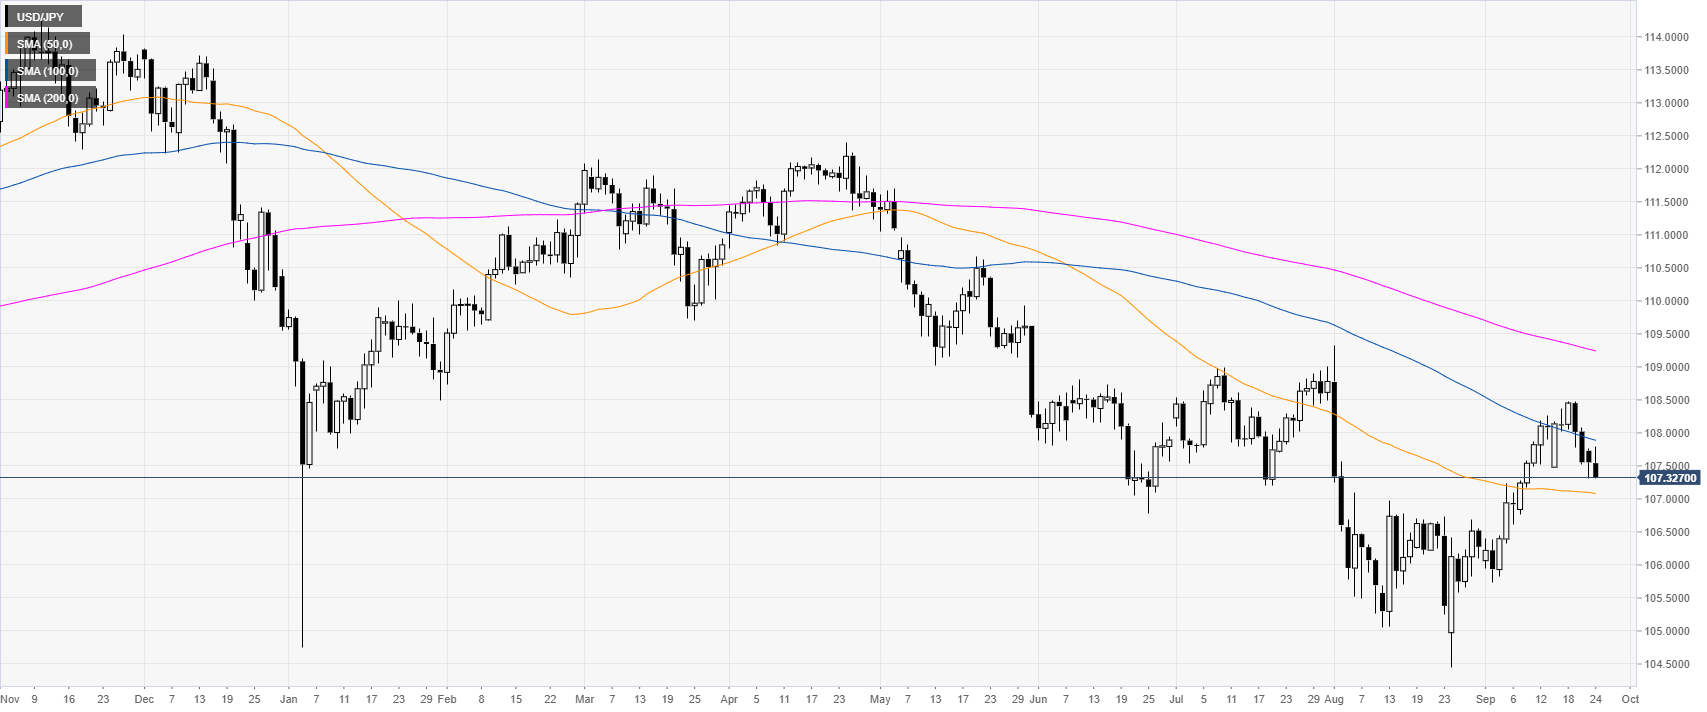
USD/JPY daily chart
USD/JPY is in a downtrend below its 100/200-day simple moving averages (SMA). The market is currently retreating down from the September highs.
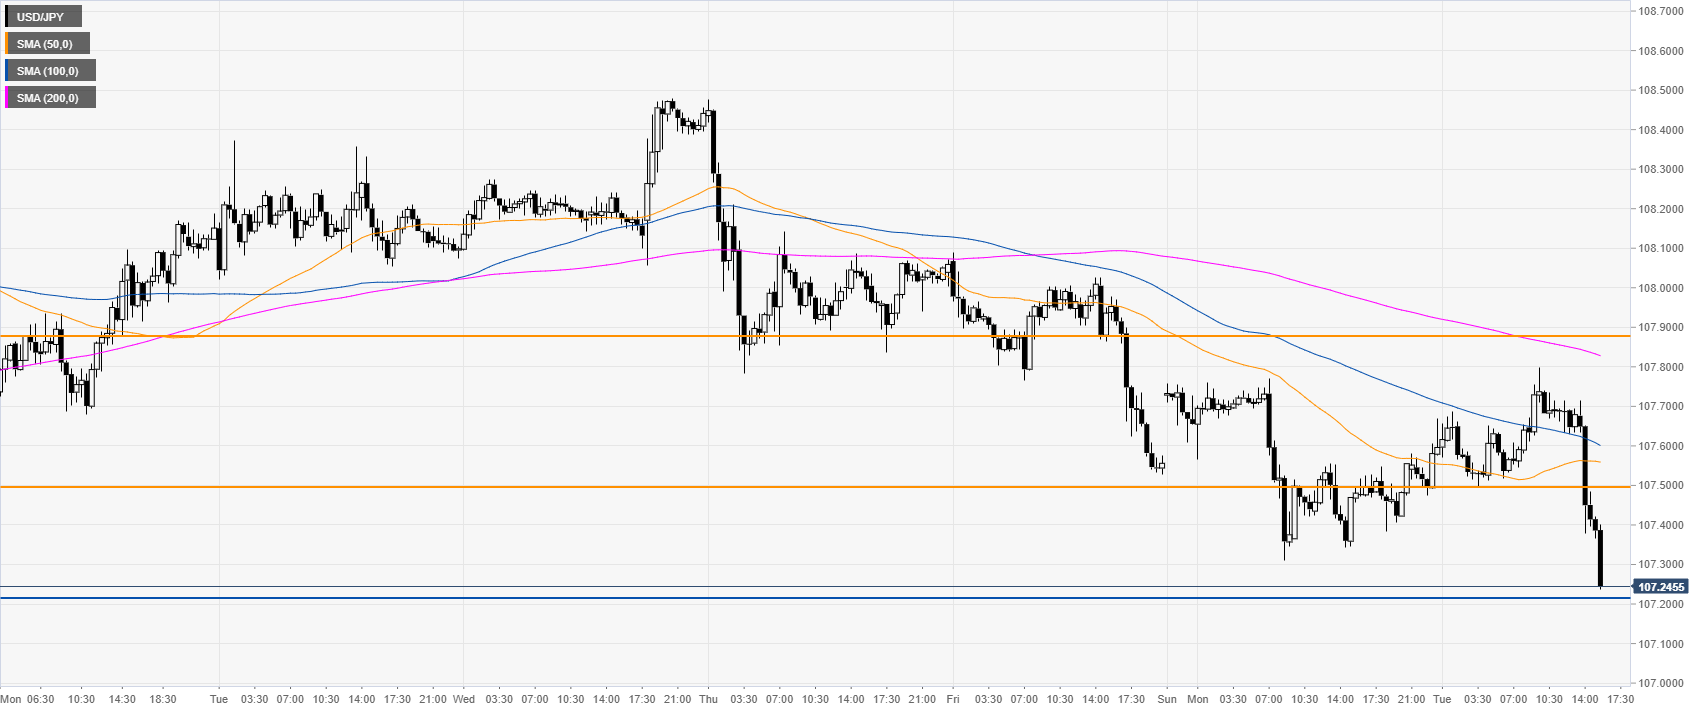
USD/JPY 4-hour chart
USD/JPY is trading below the 50 and 100 SMAs, suggesting a consolidation down in the medium term. On the way down, a break of 107.22 can expose the 106.88 support, according to the Technical Confluences Indicator.
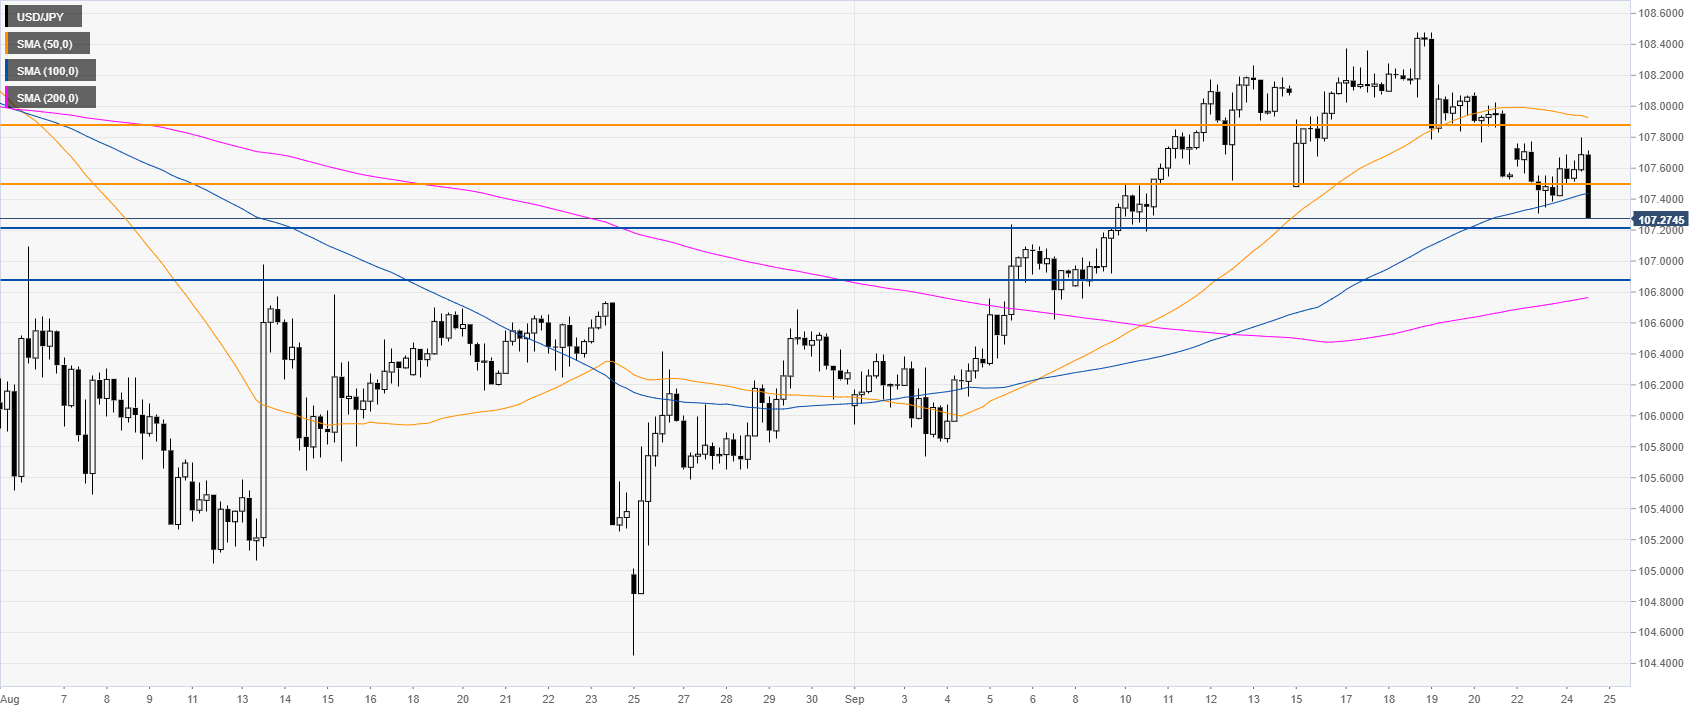
USD/JPY 30-minute chart
USD/JPY is trading below its main SMAs, suggesting a downward bias in the near term. Immediate resistances are seen at the 107.50 and 107.88 price levels, according to the Technical Confluences Indicator.
Additional key levels