Back
3 Apr 2019
BTC/USD Technical Analysis: Bitcoin breaks above 200 SMA and finds resistance at 5,200.00 level
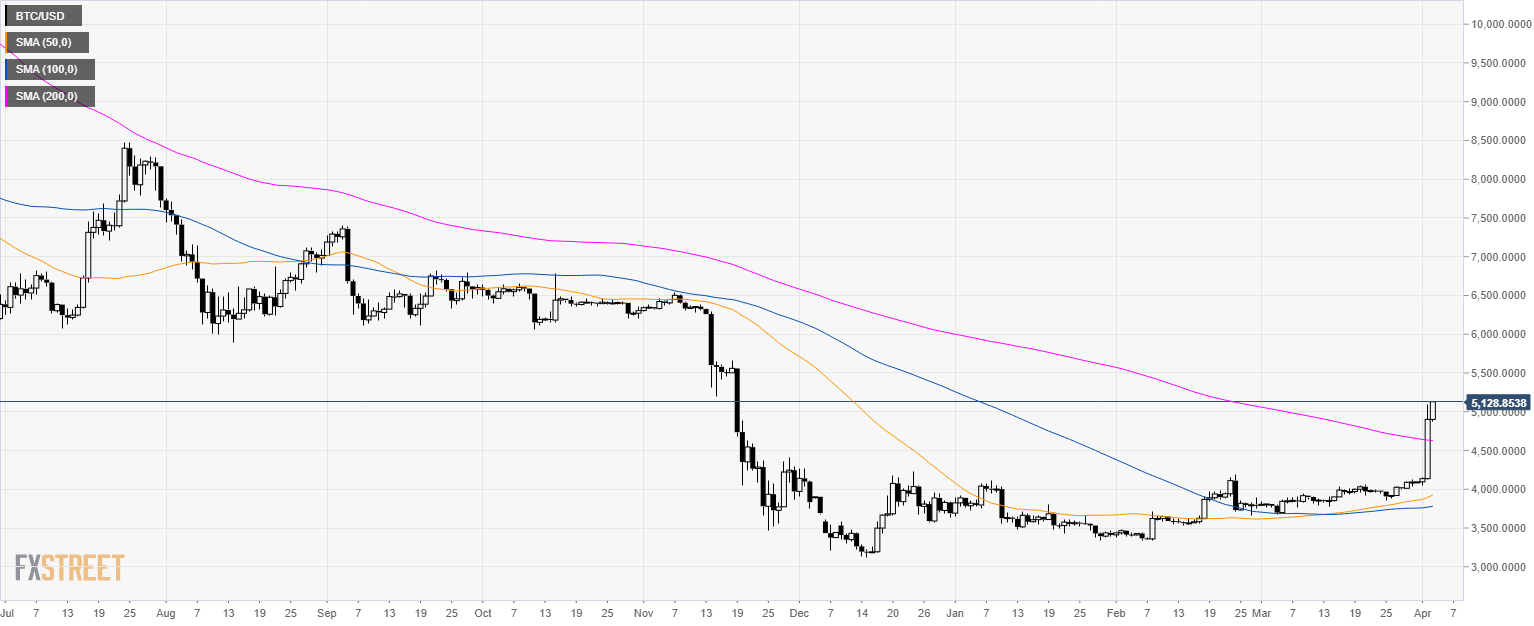
BTC/USD daily chart
- BTC/USD broke above its 200-day simple moving average (SMA) suggesting a potential bull market in the cryptocurrency.

BTC/USD 4-hour chart
- BTC/USD is trading above its main SMAs suggesting a bullish bias in the medium-term.
- Bulls will need to break above the key 61.8% Fibonacci retracement at 5,200.00 to extend the trend towards 5,800.00 and 6,600.00 resistances.
- Support is seen at 4,800.00 and 4,400.00 level.

Additional key levels
