NZD/USD Technical Analysis: breaks below a bearish double-top neckline support
• Repeated rejection near 20-day SMA constituted towards the formation of a bearish double-top chart pattern on the hourly chart.
• US-China trade tensions exert some fresh selling and drag the pair below 0.6800 handle, confirming a break below the neckline support of the bearish formation.
• Short-term technical indicators hold in negative territory and further reinforce prospects for an extension of the ongoing downfall.
NZD/USD 1-hourly chart
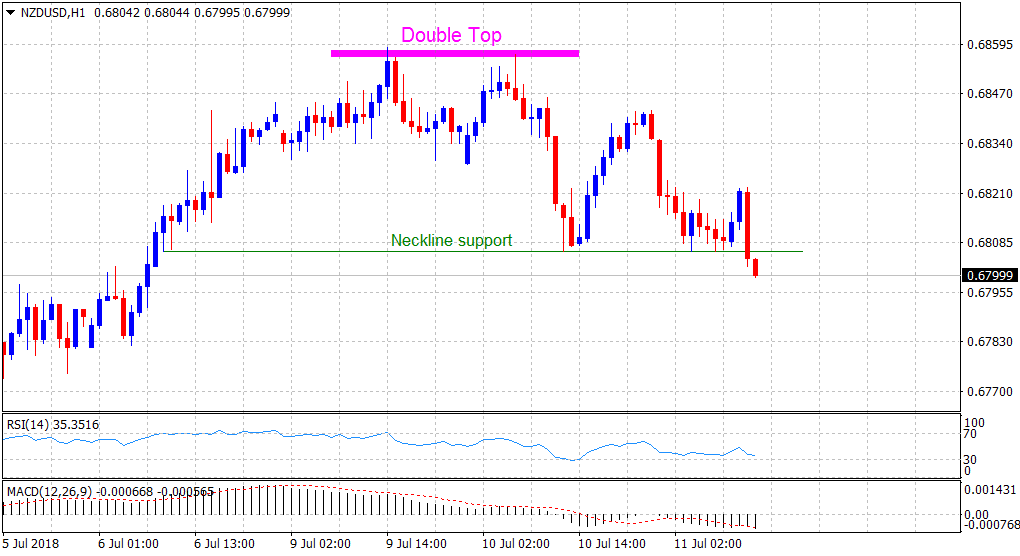
Spot Rate: 0.6799
Daily High: 0.6835
Trend: Bearish
Resistance
R1: 0.6835 (current day swing high)
R2: 0.6859 (1-1/2 week tops set on Monday)
R3: 0.6886 (R2 daily pivot-point)
Support
S1: 0.6782 (S2 daily pivot-point)
S2: 0.6750 (horizontal zone)
S3: 0.6714 (recent multi-month daily closing low)