EUR/USD Price Analysis: Seems vulnerable while below 1.0800 confluence support breakpoint
- EUR/USD trades with a mild negative bias, though the downside remains cushioned.
- September Fed rate cut bets keep the USD bulls on the defensive and lend support.
- The technical setup favors bearish traders and supports prospects for further losses.
The EUR/USD pair ticks lower during the Asian session on Wednesday and moves further away from the weekly high touched the previous day. Spot prices remain on the defensive below mid-1.0700s, though the downside seems cushioned in the wake of subdued US Dollar (USD) price action.
Political uncertainty in France – the Eurozone's second-largest economy – continues to undermine the shared currency and turns out to be a key factor acting as a headwind for the EUR/USD pair. The USD, on the other hand, languishes near the weekly low touched on Tuesday in reaction to weaker US Retail Sales data, which lifted bets for a rate cut by the Federal Reserve (Fed) in September. This, in turn, could act as a tailwind for the currency pair.
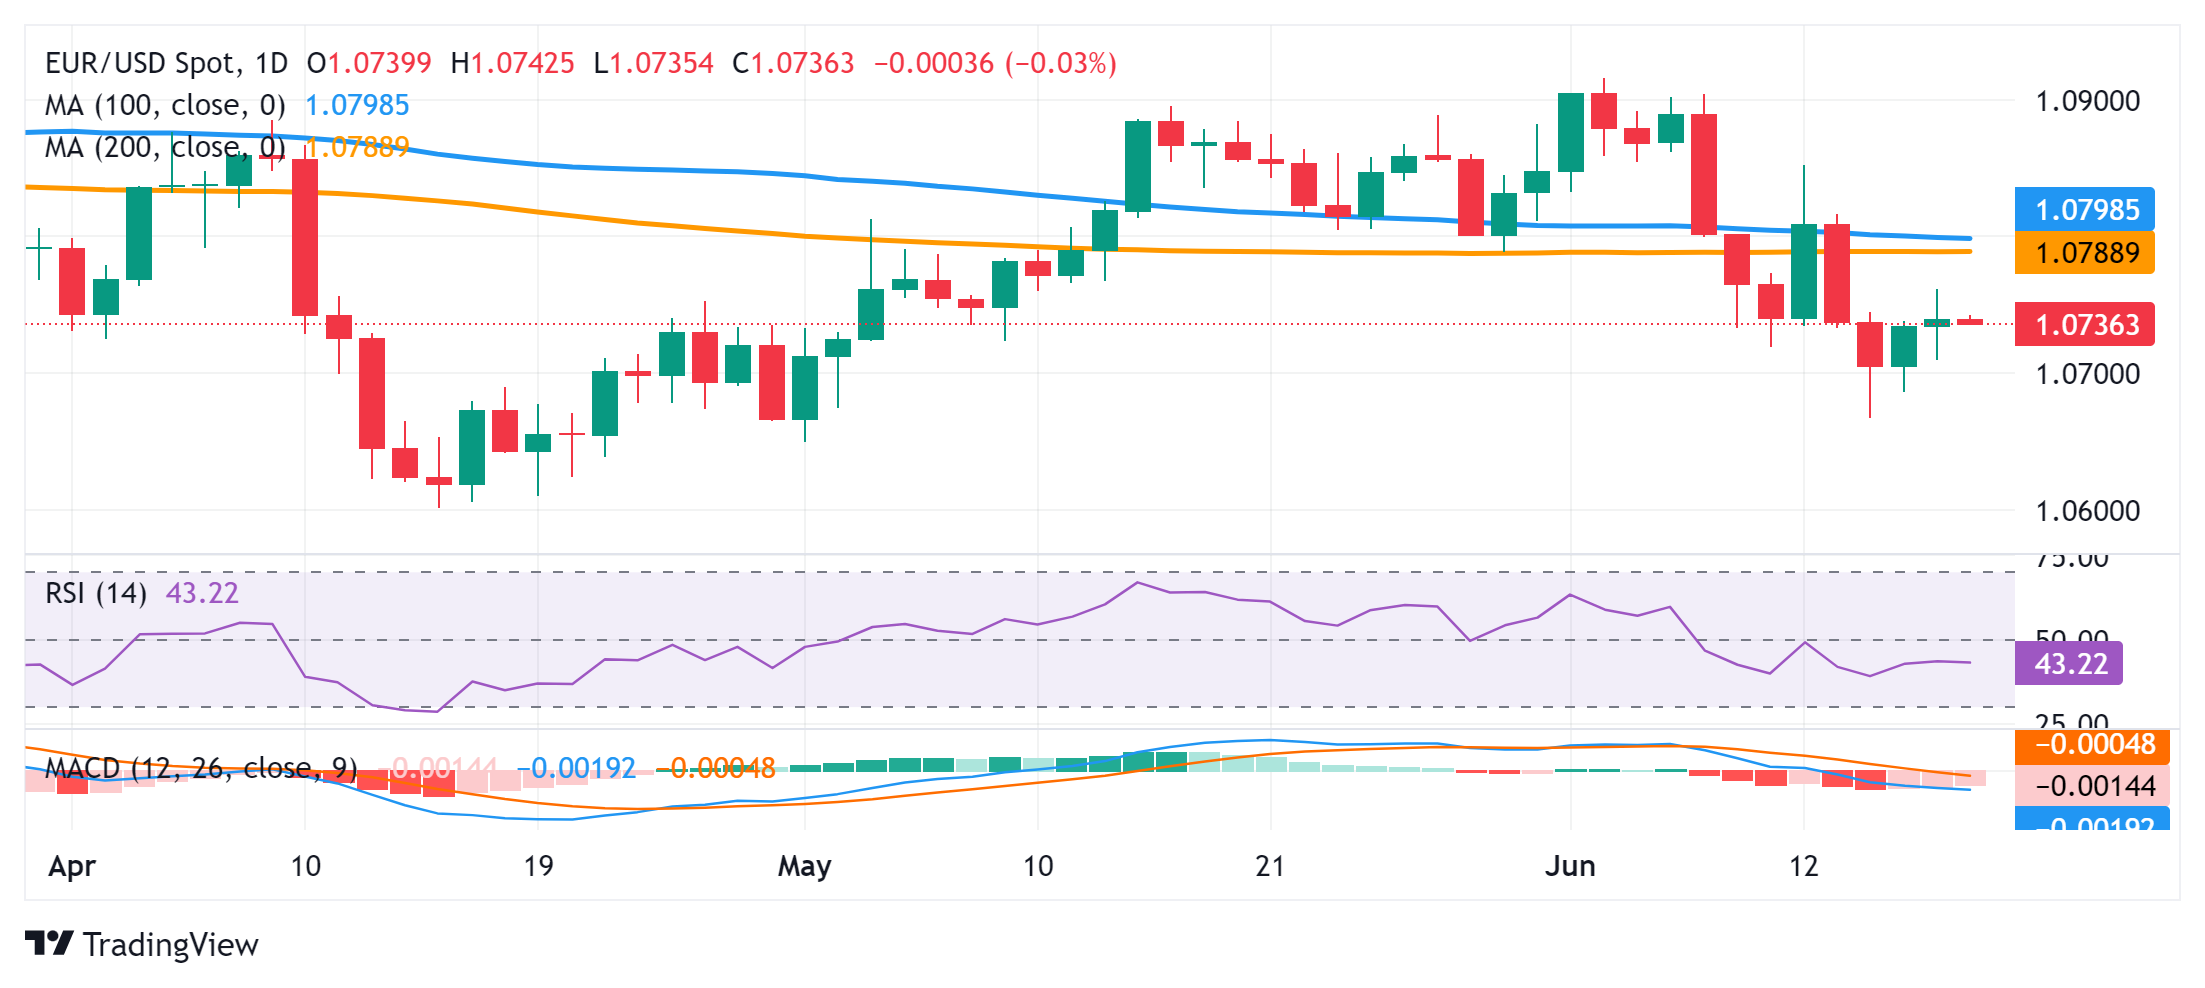
From a technical perspective, the recent breakdown through the 1.0800-1.0790 confluence, comprising the 100-day and the 200-day Simple Moving Averages (SMA) was seen as a fresh trigger for bearish traders. Moreover, oscillators on the daily chart are holding in the negative territory and are still far from being in the oversold zone. This adds credence to the negative outlook and suggests that the path of least resistance for the EUR/USD pair is to the downside.
Traders, however, might wait for a convincing break and acceptance below the 1.0700 mark before positioning for further losses. The EUR/USD pair might then accelerate the fall towards the 1.0650-1.0640 support zone before dropping to the 1.0600 mark, or the YTD low touched in April. Some follow-through selling should pave the way for an extension of the recent downtrend witnessed over the past two weeks or so, from levels just above the 1.0900 round figure.
On the flip side, any attempted positive move is likely to attract fresh sellers and remain capped near the 1.0800 confluence support-turned-resistance. The said handle should act as a key pivotal point, which if cleared decisively might prompt a short-covering rally and lift the EUR/USD pair towards the 1.0865-1.0870 supply zone en route to the 1.0900 round-figure mark.
EUR/USD daily chart